
Spectroscopy & fluorescence
Spectroscopy Lasers: Configure Around Spectrum and Sample
Lumexis supplies 525 nm fiber-coupled lasers for compatible fluorescence excitation and fixed-wavelength spectroscopy in scientific, industrial, and OEM analytical instruments.
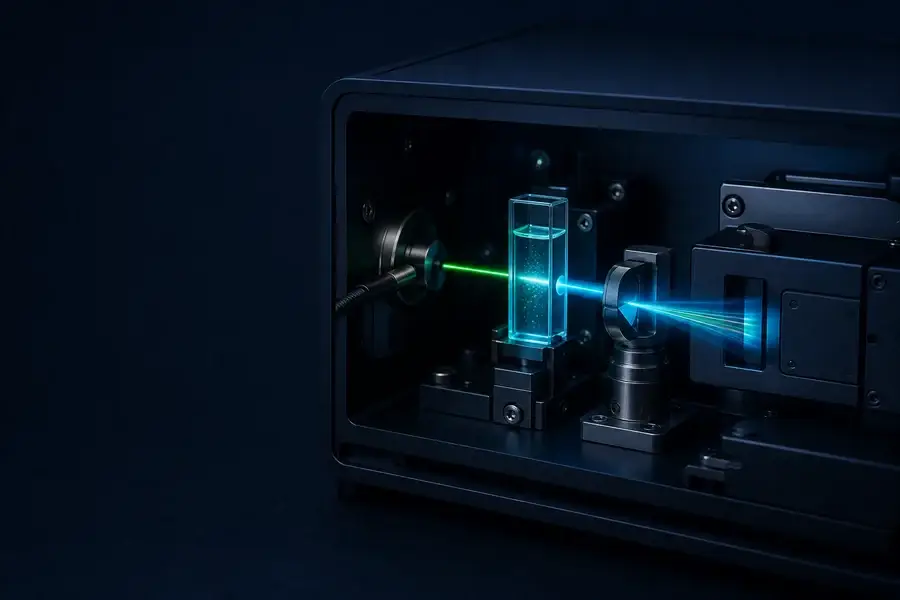
Lumexis supplies 525 nm fiber-coupled lasers for fluorescence excitation and fixed-wavelength spectroscopy in compatible scientific, industrial and OEM analytical instruments. Fiber delivery lets equipment designers place the source and its thermal interface away from the sample head, then route green optical power to a cuvette, microscope, material surface or flow cell.
525 nm is useful only when it overlaps the absorption or excitation band of the sample, marker or material being measured. It is not a universal fluorescence wavelength. Before selecting power, confirm the sample spectrum, detector response and filter set. In many analytical instruments, the required power at the sample is far below the source’s published watt-class output, so attenuation, beam expansion, splitting or a lower-power configuration must be designed deliberately.
Match the source to the analytical architecture
| Measurement architecture | What 525 nm contributes | Critical design inputs |
|---|---|---|
| 90° fluorescence spectroscopy | Fixed green excitation while emission is collected away from the direct beam | Sample absorption at 525 nm, cuvette geometry, emission spectrum, rejection filter |
| Epi-fluorescence material imaging | Fiber-delivered excitation through a dichroic and objective | Excitation/emission separation, field uniformity, objective transmission, camera sensitivity |
| Flow-cell optical interrogation | Small, stable excitation region across a liquid or particle stream | Beam waist, flow-channel geometry, dwell time, collection solid angle and background |
| Surface or coating fluorescence | Controlled spot or line on a material surface | Working distance, surface scattering, excitation irradiance and collection angle |
| Fixed-wavelength photometry | Known 525 nm input for transmission, reflectance or relative change | Optical path length, reference channel, detector linearity and source stability |
| OEM spectral-analysis platform | Excitation source for an emission spectrometer or wavelength-resolved detector | Spectrometer range, stray-light rejection, calibration and timing |
Quick match: begin with the sample’s absorption spectrum. If 525 nm produces useful excitation, define the sample-plane power and detection band. Then select the fiber and source operating point. Do not begin with the largest available wattage.
What a 525 nm laser can—and cannot—measure
Fluorescence measurement
A sample absorbs excitation photons and may emit part of that energy at longer wavelengths. The emitted signal is often weak relative to the excitation light scattered by the sample, cuvette, optics and enclosure. Optical geometry and filtering therefore matter as much as source power.
The energy of one excitation photon is:
Ephoton = hc / λ
At a fixed wavelength, increasing optical power increases the photon arrival rate. That can increase fluorescence signal in an appropriate linear regime, but only until sample saturation, photochemical change, detector saturation or heating becomes limiting.
Fixed-wavelength spectroscopy
A 525 nm source provides one controlled wavelength. It can support transmission, reflectance, scattering or emission experiments at that excitation wavelength. It does not replace a tunable source or broadband source when the objective is to scan an absorption spectrum across many wavelengths.
When a spectrometer records the light emitted by a 525 nm-excited sample, the result can be an emission spectrum. When the source wavelength itself must be scanned to produce an excitation spectrum, a fixed 525 nm laser supplies only one point unless the instrument includes additional sources or a tunable element.
Why fiber delivery helps OEM instrument design
A fiber-coupled source separates laser packaging from the measurement head. This can help the integrator:
- mount the source on a dedicated heat spreader;
- reduce heat and electrical noise near a sensitive detector;
- route light into a compact or remote sample chamber;
- exchange collimators, beam expanders or focusing heads;
- split or switch optical power between channels with a controlled optical budget;
- service the source without disturbing the calibrated sample geometry.
Fiber delivery also introduces design responsibilities. Core diameter and numerical aperture determine the output cone and achievable focus. Connector loss, fiber bend, modal distribution and end-face cleanliness can change delivered power and spatial profile.
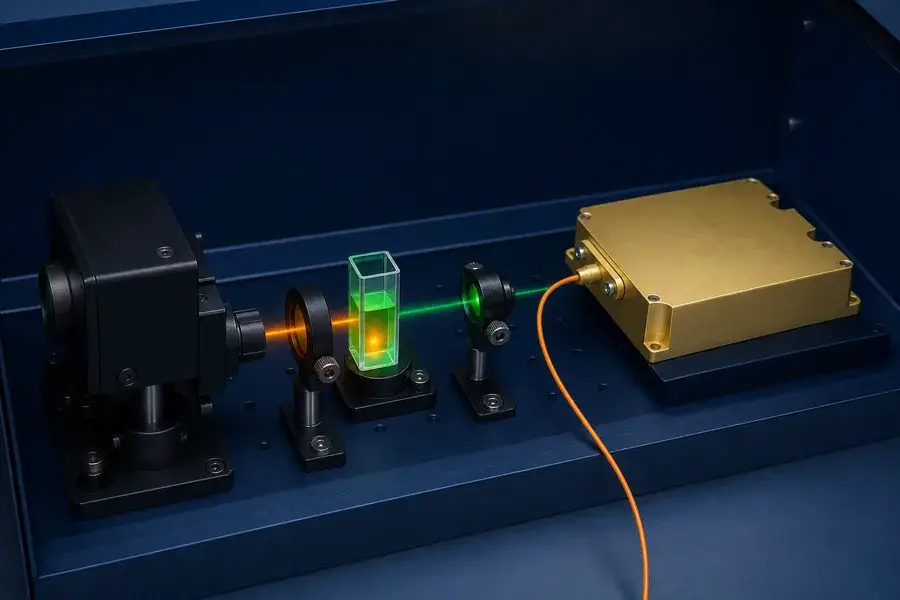
System architecture
Review the complete optical and measurement chain
525 nm fiber-coupled laser integrated with a cuvette, collection optics and analytical detector
Three practical collection geometries
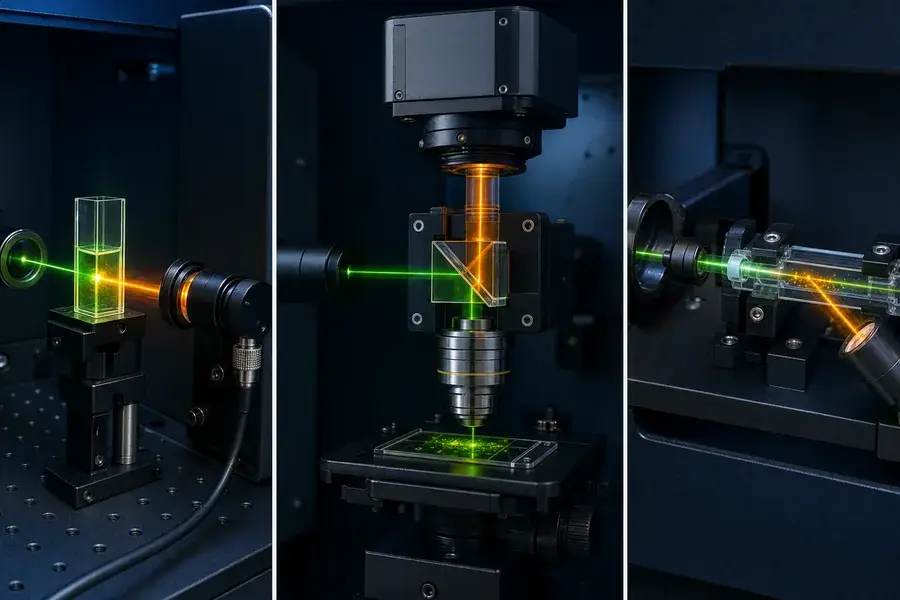
1. 90-degree cuvette collection
The green beam passes through a transparent sample cell. Fluorescence is collected at approximately 90 degrees to reduce direct transmission into the detector. An emission filter rejects residual 525 nm scatter while the spectrometer or detector measures the longer-wavelength signal.
This geometry is common in concept because it provides spatial separation between excitation and collection. Its performance depends on sample concentration, optical path length, inner-filter effects, cuvette fluorescence and the collection volume shared by the excitation beam and detector optics.
2. Epi-fluorescence imaging
A dichroic beamsplitter reflects the green excitation through an objective toward the sample. Longer-wavelength emission returns through the same objective and passes through the dichroic and an emission filter to the camera. This arrangement supports compact imaging but places demanding rejection requirements on the filter set because excitation and emission share much of the optical path.
3. Side collection from a flow cell
A focused beam intersects a transparent channel. Collection optics observe fluorescence from the illuminated volume at an angle away from the direct beam. Beam waist, channel dimensions, particle or fluid velocity, detector bandwidth and trigger timing determine signal per event.
System architecture
Review the complete optical and measurement chain
Cuvette, epi-fluorescence and flow-cell architectures using 525 nm excitation
Match 525 nm to the sample spectrum
Fluorescence excitation is governed by the overlap between source wavelength and the sample’s excitation or absorption spectrum. A manufacturer’s listed excitation maximum is a useful starting point, not a complete compatibility statement.
Check:
- excitation efficiency specifically at 525 nm;
- emission spectrum and separation from 525 nm;
- how solvent, binding, concentration, temperature or material state shifts the spectrum;
- sample autofluorescence under green illumination;
- detector sensitivity across the selected emission band;
- optical transmission of the objective, cuvette, fiber and filters.
A marker peaking at a shorter wavelength may still absorb at 525 nm, but less efficiently. Compensating with more power can increase background, photochemical stress or heating. Comparing spectral overlap and measured signal-to-background is more reliable than choosing by peak wavelength alone.
Filter design: reject excitation before increasing power
A fluorescence filter set may include an excitation filter, dichroic beamsplitter and emission filter. With a laser source, an additional excitation filter may or may not be required depending on spectral purity and system needs, but the dichroic and emission filter remain central to separating the weak signal from reflected green light.
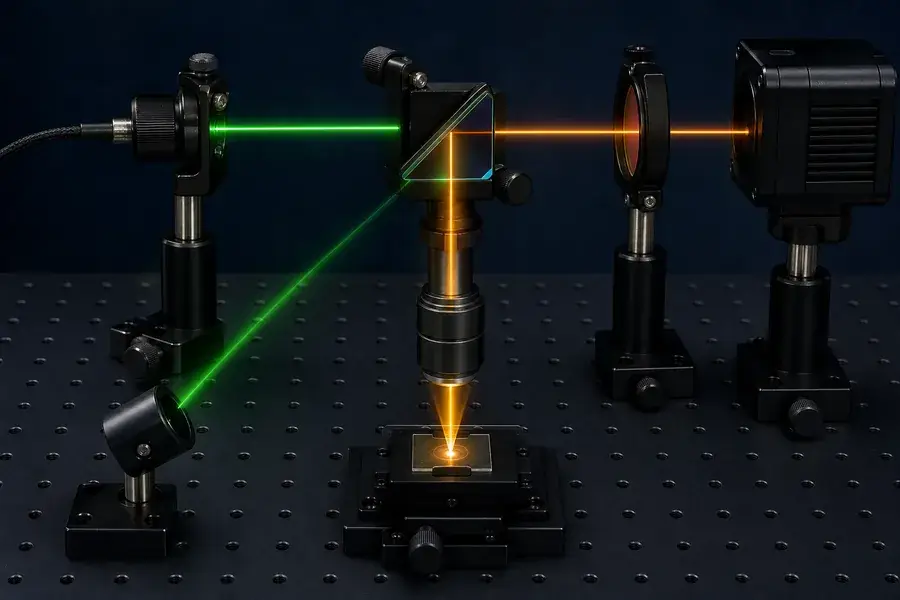
Spectral design
Match wavelength, filtering, and detector response
Conceptual 525 nm fluorescence path with dichroic separation and emission filtering
Excitation rejection
The emission channel must block the source wavelength over the full range of incidence angles and operating temperature. The relevant specification is optical density or blocking across the actual source spectrum, not only the nominal filter edge.
Emission transmission
Choose the passband to capture useful fluorescence while excluding 525 nm leakage, unwanted sample autofluorescence and adjacent channels. A broad passband collects more signal; a narrower band can improve selectivity but discards photons.
Dichroic transition region
When excitation and emission bands sit close together, the dichroic transition becomes critical. A larger Stokes shift generally makes optical separation easier. Angle of incidence, polarization and manufacturing tolerance affect the real transition curve.
Stray-light control
Blackened baffles, non-reflective mounts, beam dumps and a closed sample chamber reduce light that filters alone cannot manage. Small reflections from a cuvette edge or metal surface can exceed the fluorescence signal.
Source parameters that affect analytical performance
Sample-plane power and irradiance
Specify optical power at the sample after fiber, collimator, attenuation and other optics. For an illuminated area (A):
E = Psample / A
The same power produces very different irradiance when focused to a small spot or expanded over an image field. State spot size or illuminated area with the power value.
Stability and noise
Relative measurements can be limited by source fluctuation. Define warm-up time, short-term noise, long-term drift and repeatability after power cycling. A reference photodiode can normalize part of the variation, provided its optical pickoff and detector remain stable.
Linearity and control range
If the instrument measures concentration or relative intensity, verify that the source control, sample response and detector remain in a usable linear range. Current adjustment alone may change wavelength, spatial profile or noise. External attenuation can provide an alternative when spectral and spatial consistency is important.
Operating mode and modulation
Continuous excitation supports steady-state measurements. Modulation can enable synchronous detection or background subtraction when the driver, source and detector timing are compatible. Define frequency, duty cycle, rise/fall behavior and trigger reference.
Wavelength tolerance and spectral width
The filter and sample should tolerate the source’s actual center wavelength and width across temperature and operating conditions. For a steep sample absorption edge or tight dichroic transition, small wavelength changes can alter signal or leakage.
Fiber core, numerical aperture and output profile
The fiber sets the source étendue delivered to the sample head. Core diameter and numerical aperture must match the collimator or focusing optic. For imaging illumination, also evaluate spatial uniformity and modal structure; for a focused interrogation spot, evaluate spot size and stability at the real working distance.
Polarization
If the instrument uses polarization-sensitive samples, dichroics or measurements, define output polarization behavior and how the fiber route affects it. Standard multimode fiber delivery should not be assumed to preserve a fixed polarization state unless the configuration is designed and verified for that purpose.
Thermal integration
Watts-class green output requires a deliberate heat path at the source. At the sample, even much lower power can cause local heating or photochemical change when concentrated. Validate temperature and signal behavior over the intended exposure and duty cycle.
Photobleaching, saturation and sample protection
More excitation does not always improve data. Excess optical dose can reduce fluorescence over time, change the sample, increase background or saturate the detector.
Control optical dose through:
- the lowest irradiance that meets signal-to-noise requirements;
- shorter exposure or lower duty cycle;
- beam expansion for area illumination;
- neutral-density attenuation;
- triggered excitation only during detector acquisition;
- sample movement or flow when appropriate;
- acceptance tests across the complete measurement duration.
For process instruments, test both immediate signal and drift over repeated measurements. A stable initial reading can hide dose-dependent change that appears later in the cycle.
Lumexis 525 nm source range for OEM evaluation
| Model | Published optical power | Practical evaluation note |
|---|---|---|
| 525-LXGX0003 | 3.2 W | Lowest published family power; sample attenuation may still be required |
| 525-LXGX0004 | 4 W | Fixed-wavelength analytical source development |
| 525-LXGX0005 | 5 W | Additional optical-loss or splitting budget |
| 525-LXGX0015 | 15 W | Multi-channel, expanded-beam or higher-throughput OEM evaluation |
| 525-LXGX0020 | 20 W | Larger optical budget with dedicated thermal design |
| 525-LXGX0035 | 35 W | Specialized high-power analytical or materials platforms |
| 525-LXGX0070 | 70 W | Specialized source integration; not a default fluorescence power level |
Published power is available at the source output under the specified configuration. It is not a recommendation for power incident on a fluorophore, liquid sample or detector. Many fluorescence systems operate at much lower sample power. The optical train must provide safe, stable attenuation and containment appropriate to the instrument.
Fiber core, numerical aperture, connector, drive conditions, package and wavelength tolerance should be confirmed against the current order-specific specification.
OEM integration workflow
Step 1: confirm spectral compatibility
Provide excitation/absorption and emission spectra in the real sample environment. Define the signal band and unwanted backgrounds.
Step 2: select collection geometry
Choose 90-degree, epi, transmission, reflection or flow-cell collection. Establish sample volume, working distance and collection numerical aperture.
Step 3: define the power at the sample
Measure the minimum power and exposure that achieve the required signal-to-noise ratio. Record beam size, optical losses and sample temperature. Do not scale from source wattage without measuring delivered irradiance.
Step 4: close the filter and detector budget
Overlay source spectrum, sample emission, dichroic behavior, emission-filter transmission and detector response. Include angular effects and blocking at 525 nm.
Step 5: select fiber and output optics
Match core and numerical aperture to the collimator, beam expander or focus optic. Include connector access, bend management, strain relief and clean handling.
Step 6: validate stability and optical dose
Test warm-up, drift, repeatability, modulation, photobleaching, sample heating and detector linearity. Use reference materials or internal controls appropriate to the measurement method.
Information to send Lumexis
- sample or material and its excitation/absorption spectrum;
- target emission or detection wavelength band;
- sample geometry: cuvette, surface, microscope field or flow cell;
- required power and spot/field size at the sample;
- continuous or modulated operating mode;
- detector, spectrometer, lens and filter set;
- fiber core, numerical aperture, termination and length;
- package space, cooling method and ambient range;
- stability, monitoring and trigger requirements;
- prototype quantity, annual volume and validation schedule.
Frequently asked questions
Is 525 nm suitable for every green fluorescent marker?
No. The marker or material must absorb sufficiently at 525 nm, and the emitted signal must be separable from scattered excitation. Check the full excitation and emission spectra in the intended sample environment.
Why use a laser instead of an LED?
A laser can provide higher radiance, a defined wavelength and efficient fiber delivery into a small or remote optical head. An LED may be more suitable when broad, low-coherence illumination, lower power density or simpler cost structure is preferred. Select by the measurement, not by source category.
Is 3.2 W the recommended sample power?
No. It is the lowest published module-output power in this family. The required sample power may be far lower and should be established experimentally. Use engineered attenuation and monitor power at a defined sample plane.
Does the laser create an emission spectrum by itself?
No. It excites the sample at 525 nm. A spectrometer or wavelength-resolved detector measures the emitted spectrum. A fixed source also cannot scan an excitation spectrum without additional wavelengths.
How do I prevent 525 nm light from reaching the detector?
Use suitable collection geometry, dichroic separation, emission filtering, baffles and beam dumps. Verify blocking with the actual source spectrum and optical angles. Filter data alone does not account for scattering from every instrument surface.
Can the source be modulated for lock-in detection?
Potentially, depending on the selected source and driver. Define frequency, duty cycle, rise/fall behavior and trigger timing so Lumexis can review the appropriate operating configuration.
Configure the source around the spectrum and sample
Send the sample spectra, optical geometry, sample-plane power and detector/filter details. Lumexis will help match the 525 nm source power class, fiber interface, control method and thermal integration to a testable OEM instrument design.
Lumexis — precision laser sources, engineered for the real world.
Technical references
- NIST: Recommendations and Guidelines for Standardization of Fluorescence Spectroscopy
- Nikon MicroscopyU: Introduction to Fluorescence Microscopy
- Thermo Fisher Scientific: Selecting Optical Filters for Fluorescence Microscopy
- Thermo Fisher Scientific: Fluorophore Selection Guide
- Thorlabs: Fluorescence Imaging Filters and Sets