
Espectroscopía y fluorescencia
Láseres de espectroscopía: Configuración según espectro y muestra
Lumexis suministra 525 nm láseres acoplados a fibra para excitación de fluorescencia compatible y espectroscopía de longitud de onda fija en instrumentos analíticos científicos, industriales y OEM.
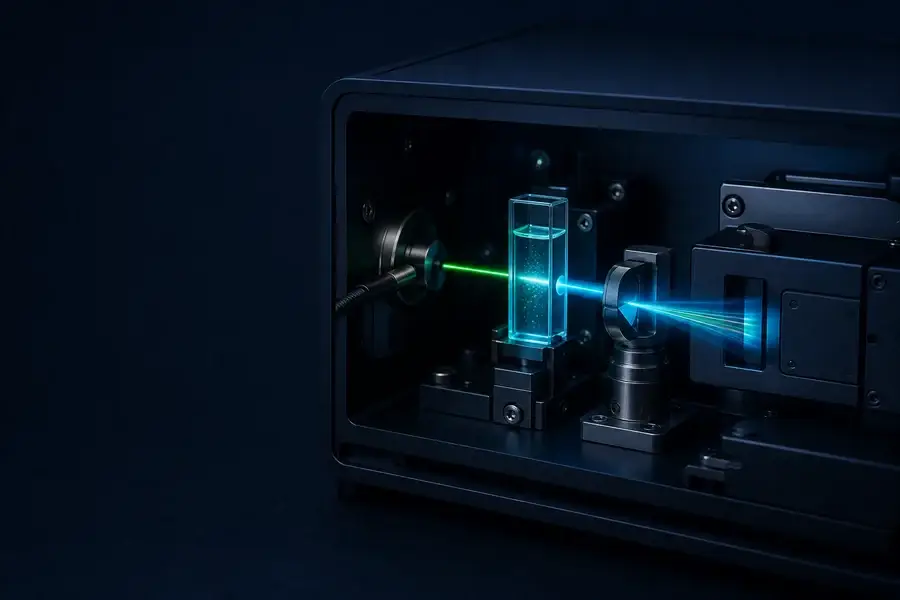
Lumexis suministra láseres de 525 nm acoplados a fibra para fluorescencia excitación y espectroscopía de longitud de onda fija en instrumentos analíticos científicos, industriales y OEM compatibles. La entrega por fibra permite a los diseñadores de equipos colocar la fuente y su interfaz térmica lejos del cabezal de muestra, y luego dirigir la potencia óptica verde a una cubeta, microscopio, superficie de material o celda de flujo.
El 525 nm es útil solo cuando se superpone con la banda de absorción o excitación de la muestra, marcador o material que se mide. No es una longitud de onda de fluorescencia universal. Antes de seleccionar la potencia, confirme el espectro de la muestra, la respuesta del detector y el conjunto de filtros. En muchos instrumentos analíticos, la potencia requerida en la muestra es mucho menor que la salida de clase de vatio publicada de la fuente, por lo que la atenuación, expansión del haz, división o una configuración de menor potencia deben diseñarse deliberadamente.
Adapte la fuente a la arquitectura analítica
| Arquitectura de medición | Qué contribuye el 525 nm | Entradas de diseño críticas |
|---|---|---|
| Espectroscopía de fluorescencia a 90° | Excitación verde fija mientras la emisión se recoge lejos del haz directo | Absorción de la muestra a 525 nm, geometría de la cubeta, espectro de emisión, filtro de rechazo |
| Imágenes de materiales por epifluorescencia | Excitación entregada por fibra a través de un dicroico y objetivo | Separación de excitación/emisión, uniformidad de campo, transmisión del objetivo, sensibilidad de la cámara |
| Interrogación óptica en celda de flujo | Región de excitación pequeña y estable a través de una corriente líquida o de partículas | Cintura del haz, geometría del canal de flujo, tiempo de residencia, ángulo sólido de recolección y fondo |
| Fluorescencia de superficie o recubrimiento | Punto o línea controlada en una superficie de material | Distancia de trabajo, dispersión de superficie, irradiancia de excitación y ángulo de recolección |
| Fotometría de longitud de onda fija | Entrada conocida de 525 nm para transmisión, reflectancia o cambio relativo | Longitud de trayectoria óptica, canal de referencia, linealidad del detector y estabilidad de la fuente |
| Plataforma de análisis espectral OEM | Fuente de excitación para un espectrómetro de emisión o detector de resolución de longitud de onda | Rango del espectrómetro, rechazo de luz dispersa, calibración y sincronización |
Coincidencia rápida: comience con el espectro de absorción de la muestra. Si el 525 nm produce excitación útil, defina la potencia en el plano de la muestra y la banda de detección. Luego seleccione la fibra y el punto de operación de la fuente. No comience con el vataje más grande disponible.
Qué puede—y qué no puede—medir un láser de 525 nm
Medición de fluorescencia
Una muestra absorbe fotones de excitación y puede emitir parte de esa energía a longitudes de onda más largas. La señal emitida es a menudo débil en relación con la luz de excitación dispersada por la muestra, cubeta, óptica y recinto. Por lo tanto, la geometría óptica y el filtrado importan tanto como la potencia de la fuente.
La energía de un fotón de excitación es:
Efotón = hc / λ
A una longitud de onda fija, aumentar la potencia óptica aumenta la tasa de llegada de fotones. Esto puede aumentar la señal de fluorescencia en un régimen lineal apropiado, pero solo hasta que la saturación de la muestra, el cambio fotoquímico, la saturación del detector o el calentamiento se vuelvan limitantes.
Espectroscopía de longitud de onda fija
Una fuente de 525 nm proporciona una longitud de onda controlada. Puede soportar experimentos de transmisión, reflectancia, dispersión o emisión a esa longitud de onda de excitación. No reemplaza una fuente sintonizable o de banda ancha cuando el objetivo es escanear un espectro de absorción a través de muchas longitudes de onda.
Cuando un espectrómetro registra la luz emitida por una muestra excitada a 525 nm, el resultado puede ser un espectro de emisión. Cuando la longitud de onda de la fuente en sí debe escanearse para producir un espectro de excitación, un láser fijo de 525 nm suministra solo un punto a menos que el instrumento incluya fuentes adicionales o un elemento sintonizable.
Por qué la entrega por fibra ayuda al diseño de instrumentos OEM
Una fuente acoplada a fibra separa el empaque del láser del cabezal de medición. Esto puede ayudar al integrador a:
- montar la fuente en un disipador de calor dedicado;
- reducir el calor y el ruido eléctrico cerca de un detector sensible;
- dirigir la luz a una cámara de muestra compacta o remota;
- intercambiar colimadores, expansores de haz o cabezales de enfoque;
- dividir o conmutar potencia óptica entre canales con un presupuesto óptico controlado;
- dar servicio a la fuente sin perturbar la geometría de muestra calibrada.
La entrega por fibra también introduce responsabilidades de diseño. El diámetro del núcleo y la apertura numérica determinan el cono de salida y el enfoque alcanzable. La pérdida del conector, la curvatura de la fibra, la distribución modal y la limpieza de la cara final pueden cambiar la potencia entregada y el perfil espacial.
Arquitectura del sistema
Revise la cadena óptica y de medición completa
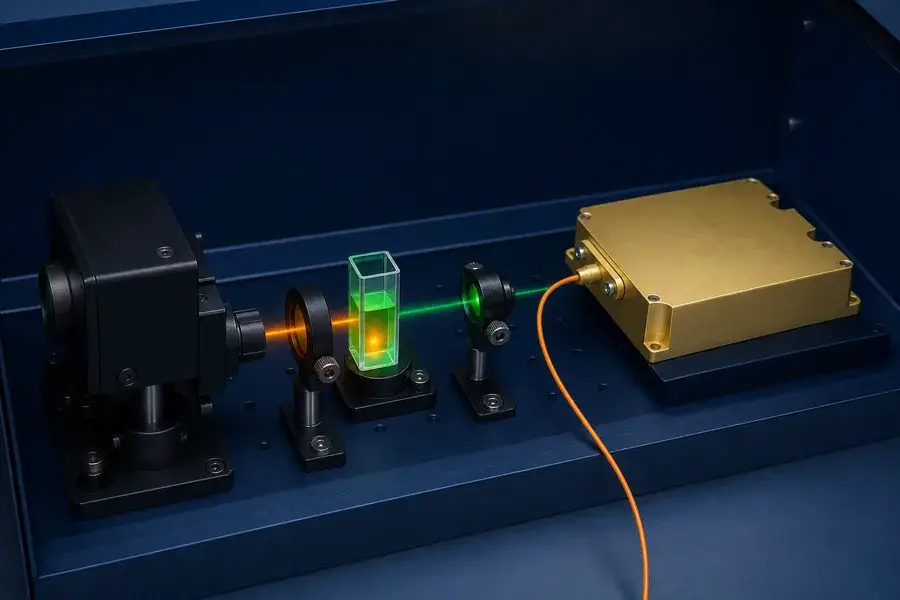
Láser acoplado por fibra de 525 nm integrado con una cubeta, óptica de colección y detector analítico
Tres geometrías de colección prácticas
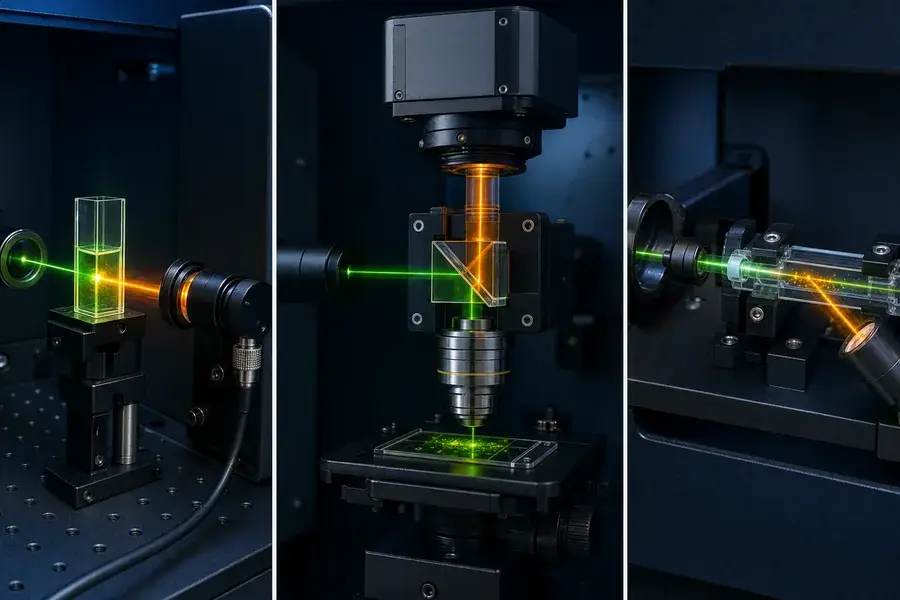
Colección con cubeta a 90 grados
El haz verde atraviesa una celda de muestra transparente. La fluorescencia se recoge a aproximadamente 90 grados para reducir la transmisión directa hacia el detector. Un filtro de emisión rechaza la dispersión residual de 525 nm mientras el espectrómetro o detector mide la señal de longitud de onda más larga.
Esta geometría es común en concepto porque proporciona separación espacial entre la excitación y la colección. Su rendimiento depende de la concentración de la muestra, la longitud de la trayectoria óptica, los efectos de filtro interno, la fluorescencia de la cubeta y el volumen de colección compartido por el haz de excitación y la óptica del detector.
Imagen de epifluorescencia
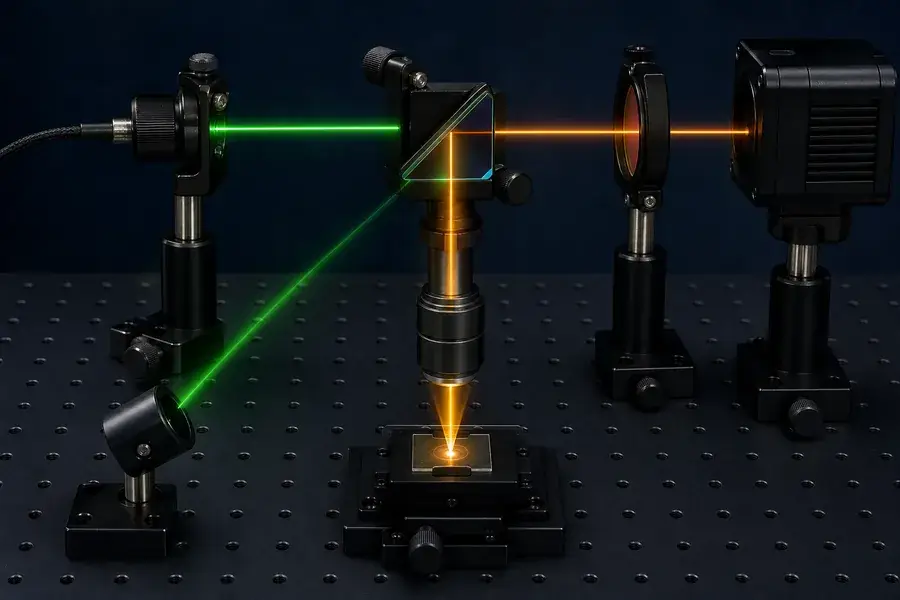
Un divisor de haz dicroico refleja la excitación verde a través de un objetivo hacia la muestra. La emisión de longitud de onda más larga regresa a través del mismo objetivo y pasa a través del dicroico y un filtro de emisión hacia la cámara. Esta disposición admite imágenes compactas, pero impone requisitos de rechazo exigentes al conjunto de filtros porque la excitación y la emisión comparten gran parte de la trayectoria óptica.
Colección lateral desde una celda de flujo
Un haz enfocado intersecta un canal transparente. La óptica de colección observa la fluorescencia del volumen iluminado en un ángulo alejado del haz directo. La cintura del haz, las dimensiones del canal, la velocidad de partículas o fluido, el ancho de banda del detector y la sincronización del disparo determinan la señal por evento.
Arquitectura del sistema
Revise la cadena óptica y de medición completa
Arquitecturas de cubeta, epifluorescencia y celda de flujo usando excitación de 525 nm
Haga coincidir 525 nm con el espectro de la muestra
La excitación de fluorescencia se rige por la superposición entre la longitud de onda de la fuente y el espectro de excitación o absorción de la muestra. El máximo de excitación listado por el fabricante es un punto de partida útil, no una declaración completa de compatibilidad.
Verifique:
- eficiencia de excitación específicamente a 525 nm;
- espectro de emisión y separación de 525 nm;
- cómo el disolvente, la unión, la concentración, la temperatura o el estado del material desplazan el espectro;
- autofluorescencia de la muestra bajo iluminación verde;
- sensibilidad del detector en la banda de emisión seleccionada;
- transmisión óptica del objetivo, cubeta, fibra y filtros.
Un marcador que alcanza su pico en una longitud de onda más corta puede aún absorber a 525 nm, pero con menos eficiencia. Compensar con más potencia puede aumentar el fondo, el estrés fotoquímico o el calentamiento. Comparar la superposición espectral y la relación señal-fondo medida es más confiable que elegir solo por la longitud de onda del pico.
Diseño de filtros: rechace la excitación antes de aumentar la potencia
Un conjunto de filtros de fluorescencia puede incluir un filtro de excitación, un divisor de haz dicroico y un filtro de emisión. Con una fuente láser, un filtro de excitación adicional puede o no ser necesario dependiendo de la pureza espectral y las necesidades del sistema, pero el dicroico y el filtro de emisión siguen siendo centrales para separar la señal débil de la luz verde reflejada.
Diseño espectral
Haga coincidir longitud de onda, filtrado y respuesta del detector
Trayectoria conceptual de fluorescencia de 525 nm con separación dicroica y filtrado de emisión
Rechazo de excitación
El canal de emisión debe bloquear la longitud de onda de la fuente en todo el rango de ángulos de incidencia y temperatura de operación. La especificación relevante es la densidad óptica o bloqueo en todo el espectro real de la fuente, no solo el borde nominal del filtro.
Transmisión de emisión
Elija la banda de paso para capturar fluorescencia útil mientras excluye fugas de 525 nm, autofluorescencia no deseada de la muestra y canales adyacentes. Una banda de paso amplia recoge más señal; una banda más estrecha puede mejorar la selectividad pero descarta fotones.
Región de transición del dicroico
Cuando las bandas de excitación y emisión están cercanas, la transición del dicroico se vuelve crítica. Un desplazamiento de Stokes más grande generalmente facilita la separación óptica. El ángulo de incidencia, la polarización y la tolerancia de fabricación afectan la curva de transición real.
Control de luz dispersa
Deflectores ennegrecidos, montajes no reflectantes, trampas de haz y una cámara de muestra cerrada reducen la luz que los filtros por sí solos no pueden manejar. Pequeñas reflexiones desde un borde de cubeta o superficie metálica pueden exceder la señal de fluorescencia.
Parámetros de la fuente que afectan el rendimiento analítico
Potencia e irradiancia en el plano de muestra
Especifique la potencia óptica en la muestra después de fibra, colimador, atenuación y otra óptica. Para un área iluminada (A):
E = Pmuestra / A
La misma potencia produce irradiancia muy diferente cuando se enfoca en un punto pequeño o se expande sobre un campo de imagen. Indique el tamaño del punto o área iluminada junto con el valor de potencia.
Estabilidad y ruido
Las mediciones relativas pueden estar limitadas por la fluctuación de la fuente. Defina el tiempo de calentamiento, ruido a corto plazo, deriva a largo plazo y repetibilidad después de ciclos de encendido. Un fotodiodo de referencia puede normalizar parte de la variación, siempre que su derivación óptica y detector permanezcan estables.
Linealidad y rango de control
Si el instrumento mide concentración o intensidad relativa, verifique que el control de la fuente, la respuesta de la muestra y el detector permanezcan en un rango lineal utilizable. El ajuste de corriente por sí solo puede cambiar la longitud de onda, el perfil espacial o el ruido. La atenuación externa puede proporcionar una alternativa cuando la consistencia espectral y espacial es importante.
Modo de operación y modulación
La excitación continua admite mediciones de estado estacionario. La modulación puede permitir detección síncrona o sustracción de fondo cuando el controlador, la fuente y la sincronización del detector son compatibles. Defina frecuencia, ciclo de trabajo, comportamiento de subida/bajada y referencia de disparo.
Tolerancia de longitud de onda y ancho espectral
El filtro y la muestra deben tolerar la longitud de onda central real y el ancho de la fuente en condiciones de temperatura y operación. Para un borde de absorción de muestra pronunciado o una transición dicroica ajustada, pequeños cambios de longitud de onda pueden alterar la señal o la fuga.
Núcleo de fibra, apertura numérica y perfil de salida
La fibra establece la étendue de la fuente entregada al cabezal de muestra. El diámetro del núcleo y la apertura numérica deben coincidir con el colimador o la óptica de enfoque. Para iluminación de imagen, evalúe también la uniformidad espacial y la estructura modal; para un punto de interrogación enfocado, evalúe el tamaño del punto y la estabilidad a la distancia de trabajo real.
Polarización
Si el instrumento utiliza muestras sensibles a la polarización, dicroicos o mediciones, defina el comportamiento de polarización de salida y cómo la ruta de la fibra lo afecta. La entrega estándar de fibra multimodo no debe asumirse que preserva un estado de polarización fijo a menos que la configuración esté diseñada y verificada para ese propósito.
Integración térmica
La salida verde de clase vatio requiere una ruta de calor deliberada en la fuente. En la muestra, incluso una potencia mucho menor puede causar calentamiento local o cambio fotoquímico cuando se concentra. Valide la temperatura y el comportamiento de la señal durante la exposición y el ciclo de trabajo previstos.
Fotoblanqueo, saturación y protección de la muestra
Más excitación no siempre mejora los datos. Una dosis óptica excesiva puede reducir la fluorescencia con el tiempo, cambiar la muestra, aumentar el fondo o saturar el detector.
Controle la dosis óptica mediante:
- la irradiancia más baja que cumpla con los requisitos de relación señal-ruido;
- exposición más corta o menor ciclo de trabajo;
- expansión del haz para iluminación de área;
- atenuación con filtros de densidad neutra;
- excitación activada solo durante la adquisición del detector;
- movimiento o flujo de la muestra cuando sea apropiado;
- pruebas de aceptación durante la duración completa de la medición.
Para instrumentos de proceso, pruebe tanto la señal inmediata como la deriva en mediciones repetidas. Una lectura inicial estable puede ocultar cambios dependientes de la dosis que aparecen más tarde en el ciclo.
Gama de fuentes Lumexis de 525 nm para evaluación OEM
| Modelo | Potencia óptica publicada | Nota práctica de evaluación |
|---|---|---|
| 525-LXGX0003 | 2 W | Potencia familiar publicada más baja; puede ser necesaria atenuación de la muestra |
| 525-LXGX0004 | 4 W | Desarrollo de fuente analítica de longitud de onda fija |
| 525-LXGX0005 | 5 W | Presupuesto adicional de pérdida óptica o división |
| 525-LXGX0015 | 15 W | Evaluación OEM multicanal, de haz expandido o de mayor rendimiento |
| 525-LXGX0020 | 20 W | Mayor presupuesto óptico con diseño térmico dedicado |
| 525-LXGX0035 | 35 W | Plataformas analíticas o de materiales especializadas de alta potencia |
| 525-LXGX0070 | 70 W | Integración de fuente especializada; no es un nivel de potencia de fluorescencia predeterminado |
La potencia publicada está disponible en la salida de la fuente bajo la configuración especificada. No es una recomendación para la potencia incidente sobre un fluoróforo, muestra líquida o detector. Muchos sistemas de fluorescencia operan con potencia de muestra mucho menor. El tren óptico debe proporcionar atenuación y contención seguras y estables apropiadas para el instrumento.
El núcleo de fibra, la apertura numérica, el conector, las condiciones de conducción, el paquete y la tolerancia de longitud de onda deben confirmarse contra la especificación actual específica del pedido.
Flujo de trabajo de integración OEM
Paso 1: confirmar la compatibilidad espectral
Proporcione espectros de excitación/absorción y emisión en el entorno real de la muestra. Defina la banda de señal y los fondos no deseados.
Paso 2: seleccionar la geometría de recolección
Elija recolección a 90 grados, epi, transmisión, reflexión o celda de flujo. Establezca el volumen de muestra, la distancia de trabajo y la apertura numérica de recolección.
Paso 3: definir la potencia en la muestra
Mida la potencia mínima y la exposición que logren la relación señal-ruido requerida. Registre el tamaño del haz, las pérdidas ópticas y la temperatura de la muestra. No escale desde el vataje de la fuente sin medir la irradiancia entregada.
Paso 4: cerrar el presupuesto de filtros y detector
Superponga el espectro de la fuente, la emisión de la muestra, el comportamiento dicroico, la transmisión del filtro de emisión y la respuesta del detector. Incluya efectos angulares y bloqueo a 525 nm.
Paso 5: seleccionar la fibra y la óptica de salida
Haga coincidir el núcleo y la apertura numérica con el colimador, el expansor de haz o la óptica de enfoque. Incluya acceso al conector, gestión de curvatura, alivio de tensión y manejo limpio.
Paso 6: validar la estabilidad y la dosis óptica
Pruebe el calentamiento, la deriva, la repetibilidad, la modulación, el fotoblanqueo, el calentamiento de la muestra y la linealidad del detector. Use materiales de referencia o controles internos apropiados para el método de medición.
Información para enviar a Lumexis
- muestra o material y su espectro de excitación/absorción;
- banda de longitud de onda de emisión o detección objetivo;
- geometría de la muestra: cubeta, superficie, campo de microscopio o celda de flujo;
- potencia requerida y tamaño de punto/campo en la muestra;
- modo de operación continuo o modulado;
- detector, espectrómetro, lente y conjunto de filtros;
- núcleo de fibra, apertura numérica, terminación y longitud;
- espacio del paquete, método de enfriamiento y rango ambiental;
- estabilidad, requisitos de monitoreo y disparo;
- cantidad de prototipos, volumen anual y cronograma de validación.
Preguntas frecuentes
¿Es 525 nm adecuado para cada marcador fluorescente verde?
No. El marcador o material debe absorber suficientemente a 525 nm, y la señal emitida debe ser separable de la excitación dispersada. Verifique los espectros completos de excitación y emisión en el entorno de muestra previsto.
¿Por qué usar un láser en lugar de un LED?
Un láser puede proporcionar mayor radiancia, una longitud de onda definida y una entrega eficiente por fibra hacia un cabezal óptico pequeño o remoto. Un LED puede ser más adecuado cuando se prefiere una iluminación amplia y de baja coherencia, una menor densidad de potencia o una estructura de costos más simple. Seleccione según la medición, no por categoría de fuente.
¿Es 3.2 W la potencia de muestra recomendada?
No. Es la potencia de salida de módulo más baja publicada en esta familia. La potencia de muestra requerida puede ser mucho menor y debe establecerse experimentalmente. Use atenuación diseñada y monitoree la potencia en un plano de muestra definido.
¿El láser crea un espectro de emisión por sí mismo?
No. Excita la muestra a 525 nm. Un espectrómetro o detector resuelto en longitud de onda mide el espectro emitido. Una fuente fija tampoco puede escanear un espectro de excitación sin longitudes de onda adicionales.
¿Cómo evito que la luz de 525 nm llegue al detector?
Utilice una geometría de recolección adecuada, separación dicroica, filtrado de emisión, deflectores y trampas de haz. Verifique el bloqueo con el espectro real de la fuente y los ángulos ópticos. Los datos de filtro por sí solos no tienen en cuenta la dispersión de cada superficie del instrumento.
¿Puede la fuente ser modulada para detección lock-in?
Potencialmente, dependiendo de la fuente y el controlador seleccionados. Defina la frecuencia, el ciclo de trabajo, el comportamiento de subida/bajada y la sincronización del disparo para que Lumexis pueda revisar la configuración operativa adecuada.
Configure la fuente alrededor del espectro y la muestra
Envíe los espectros de la muestra, la geometría óptica, la potencia en el plano de la muestra y los detalles del detector/filtro. Lumexis ayudará a igualar la clase de potencia de la fuente de 525 nm, la interfaz de fibra, el método de control y la integración térmica a un diseño de instrumento OEM comprobable.
Lumexis: fuentes láser de precisión, diseñadas para el mundo real.
Referencias técnicas
- NIST: Recomendaciones y pautas para la estandarización de la espectroscopía de fluorescencia
- Nikon MicroscopyU: Introducción a la microscopía de fluorescencia
- Thermo Fisher Scientific: Selección de filtros ópticos para microscopía de fluorescencia
- Thermo Fisher Scientific: Guía de selección de fluoróforos
- Thorlabs: Filtros y conjuntos de imágenes de fluorescencia